Personal Finance Analysis
A non-scientific, statistically-insignificant analysis and visualization of my personal spending. Data also utilized to create web API and ML bot.
Some interesting observations:
- My spending behaviour is dependent on location (Figure 1.)
- My eating behaviour is dependent on day of week (Figure 2.)
- My most frequented stores are Superstore and McDonald's (Figure 3.)
- Housing and transportation is the only spending category that is projected to increase over time (Figure 4.)
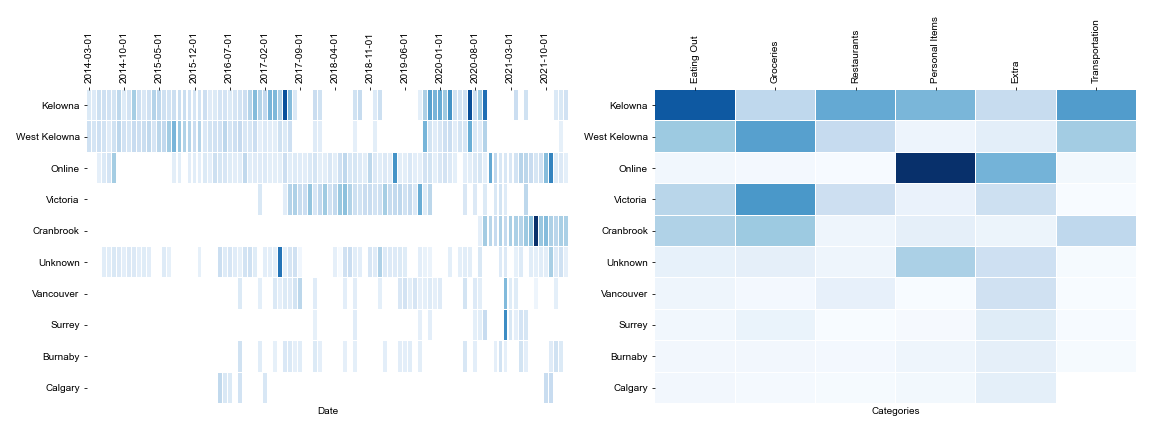
Figure 1. Heatmap of cumulative personal spending by month and location.
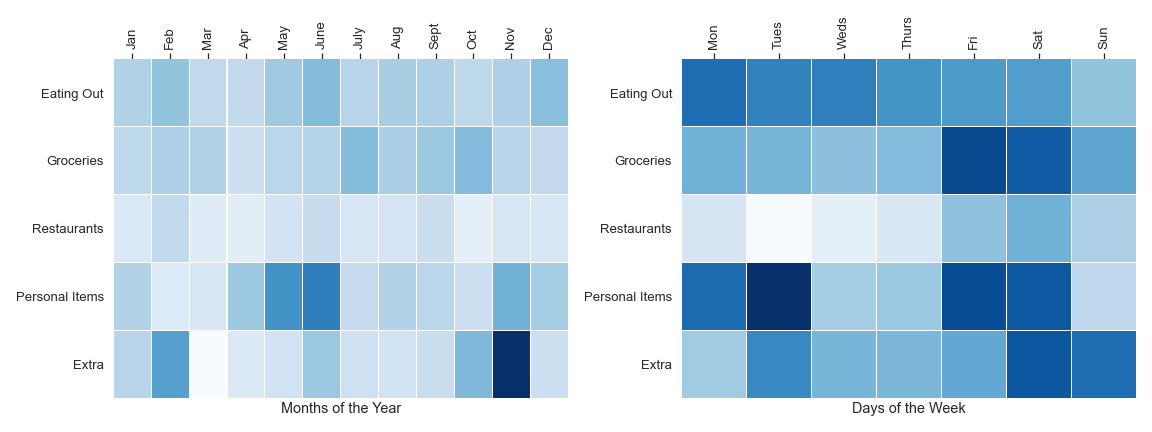
Figure 2. Heatmap of cumulative personal spending by category and months of the year/days of the week.
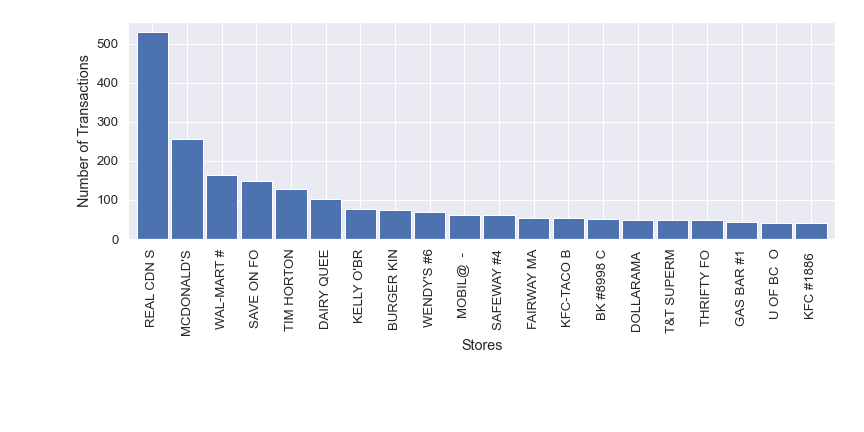
Figure 3. Most frequented stores 2014-2020.
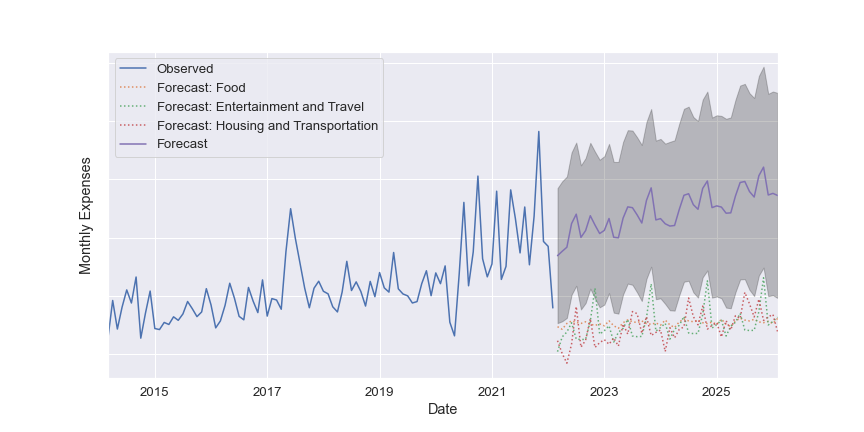
Figure 4. Forecasting personal spending 2021-2025.